Index of Industrial Production up by 3.8% in Nov 2014
Updated: Jan 13, 2015 02:16:12pm

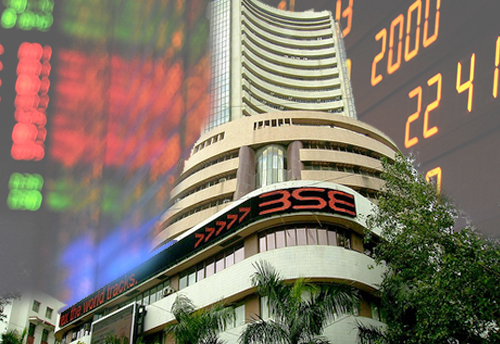
New Delhi, Jan 13 (KNN) Index of Industrial Production (IIP) that measures industrial activity has shown a better than expected growth of 3.8 per cent in November 2014 when compared to the corresponding month last year.
The cumulative growth for the period April-November 2014-15 over the corresponding period of the previous year stands at 2.2 per cent, an official release said.
The Quick Estimates of Index of Industrial Production (IIP) with base 2004-05 for the month of November 2014 were released by the Central Statistics Office of the Ministry of Statistics and Programme Implementation on Monday.
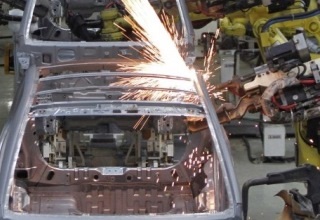
The improvement in November can be attributed to higher output in the sectors of mining (3.4 per cent from 1.6 per cent in November 2013), manufacturing (3 per cent from 2.6 per cent) and electricity (10 per cent from 6.3 per cent).
In terms of industries, 16 out of the twenty two 22 industry groups in the manufacturing sector have shown positive growth during the month of November 2014 as compared to the corresponding month of the previous year.
The industry group ‘Wearing apparel; dressing and dyeing of fur’ has shown the highest positive growth of 19.8 per cent, followed by 17.5 per cent in ‘Motor vehicles, trailers and semi-trailers’ and 12.8 per cent in ‘Fabricated metal products, except machinery and equipment’.
On the other hand, the industry group ‘Radio, TV and communication equipment and apparatus’ has shown the highest negative growth of (-) 60.0 per cent, followed by (-) 26.3 per cent in ‘Office, accounting and computing machinery’ and (-) 17.4 per cent in ‘Tobacco products’.
Manufacturing of basic, capital and intermediate goods also showed healthy growth in November 2014 over November 2013, with 7 per cent growth in basic goods; 6.5 per cent growth in capital goods and 4.3 per cent growth in intermediate goods.
<span new="" mso-ansi-language:en-in`="" ";="">
As far as Consumer durables and Consumer non-durables are concerned, they have recorded growth of (-) 14.5 per cent and 6.0 per cent respectively, with the overall growth in Consumer goods being (-) 2.2 per cent.
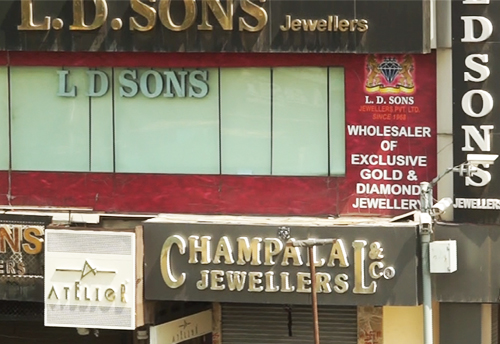
Some of the important items showing high positive growth during the current month over the same month in previous year include ‘H R Sheets’ (240.8 per cent), ‘Conductor, Aluminium’ (115.0 per cent), ‘Air Conditioner (Room)’ (53.8 per cent), ‘Sugar’ (49.5 per cent), ‘Three-Wheelers (Including passenger and goods carrier)’ (42.5 per cent), ‘Leather Garments’ (40.3 per cent), ‘Ayurvedic Medicaments’ (35.3 per cent), ‘Stampings and Forgings’ (34.1 per cent), ‘Scooter and Mopeds’ (30.7 per cent), ‘Stainless/ alloy steel’ (26.5 per cent), ‘Cotton cloth’ (23.8 per cent), ‘Rice’ (23.0 per cent) and ‘Commercial Vehicles’ (20.0 per cent).
On the other hand, items showing high negative growth are: ‘Telephone Instruments (incl. Mobile Phones and Accessories)’ [(-) 67.3 per cent], ‘Ship Building and Repairs’ [(-) 41.1 per cent], ‘Wood Furniture’ [(-) 41.1 per cent], ‘Sugar Machinery’ [(-) 40.9 per cent], ‘Cement Machinery’ [(-) 38.9 per cent], ‘Glass Sheet’ [(-) 30.1 per cent], ‘Generator/ Alternator’ [(-) 28.6 per cent], ‘Lubricating oil’ [(-) 27.1 per cent], ‘Cigarettes [(-) 23.3 per cent] and ‘Antibiotics and Its Preparations’ [(-) 20.7 per cent].
IIP is compiled using data received from 16 source agencies namely Department of Industrial Policy and Promotion (DIPP); Indian Bureau of Mines; Central Electricity Authority; Joint Plant Committee; Ministry of Petroleum and Natural Gas; Office of Textile Commissioner; Department of Chemicals and Petrochemicals; Directorate of Sugar; Department of Fertilizers; Directorate of Vanaspati, Vegetable Oils and Fats; Tea Board; Office of Jute Commissioner; Office of Coal Controller; Railway Board; Office of Salt Commissioner and Coffee Board. (KNN/ES)
The cumulative growth for the period April-November 2014-15 over the corresponding period of the previous year stands at 2.2 per cent, an official release said.
The Quick Estimates of Index of Industrial Production (IIP) with base 2004-05 for the month of November 2014 were released by the Central Statistics Office of the Ministry of Statistics and Programme Implementation on Monday.
The improvement in November can be attributed to higher output in the sectors of mining (3.4 per cent from 1.6 per cent in November 2013), manufacturing (3 per cent from 2.6 per cent) and electricity (10 per cent from 6.3 per cent).
In terms of industries, 16 out of the twenty two 22 industry groups in the manufacturing sector have shown positive growth during the month of November 2014 as compared to the corresponding month of the previous year.
The industry group ‘Wearing apparel; dressing and dyeing of fur’ has shown the highest positive growth of 19.8 per cent, followed by 17.5 per cent in ‘Motor vehicles, trailers and semi-trailers’ and 12.8 per cent in ‘Fabricated metal products, except machinery and equipment’.
On the other hand, the industry group ‘Radio, TV and communication equipment and apparatus’ has shown the highest negative growth of (-) 60.0 per cent, followed by (-) 26.3 per cent in ‘Office, accounting and computing machinery’ and (-) 17.4 per cent in ‘Tobacco products’.
Manufacturing of basic, capital and intermediate goods also showed healthy growth in November 2014 over November 2013, with 7 per cent growth in basic goods; 6.5 per cent growth in capital goods and 4.3 per cent growth in intermediate goods.
<span new="" mso-ansi-language:en-in`="" ";="">
As far as Consumer durables and Consumer non-durables are concerned, they have recorded growth of (-) 14.5 per cent and 6.0 per cent respectively, with the overall growth in Consumer goods being (-) 2.2 per cent.
Some of the important items showing high positive growth during the current month over the same month in previous year include ‘H R Sheets’ (240.8 per cent), ‘Conductor, Aluminium’ (115.0 per cent), ‘Air Conditioner (Room)’ (53.8 per cent), ‘Sugar’ (49.5 per cent), ‘Three-Wheelers (Including passenger and goods carrier)’ (42.5 per cent), ‘Leather Garments’ (40.3 per cent), ‘Ayurvedic Medicaments’ (35.3 per cent), ‘Stampings and Forgings’ (34.1 per cent), ‘Scooter and Mopeds’ (30.7 per cent), ‘Stainless/ alloy steel’ (26.5 per cent), ‘Cotton cloth’ (23.8 per cent), ‘Rice’ (23.0 per cent) and ‘Commercial Vehicles’ (20.0 per cent).
On the other hand, items showing high negative growth are: ‘Telephone Instruments (incl. Mobile Phones and Accessories)’ [(-) 67.3 per cent], ‘Ship Building and Repairs’ [(-) 41.1 per cent], ‘Wood Furniture’ [(-) 41.1 per cent], ‘Sugar Machinery’ [(-) 40.9 per cent], ‘Cement Machinery’ [(-) 38.9 per cent], ‘Glass Sheet’ [(-) 30.1 per cent], ‘Generator/ Alternator’ [(-) 28.6 per cent], ‘Lubricating oil’ [(-) 27.1 per cent], ‘Cigarettes [(-) 23.3 per cent] and ‘Antibiotics and Its Preparations’ [(-) 20.7 per cent].
IIP is compiled using data received from 16 source agencies namely Department of Industrial Policy and Promotion (DIPP); Indian Bureau of Mines; Central Electricity Authority; Joint Plant Committee; Ministry of Petroleum and Natural Gas; Office of Textile Commissioner; Department of Chemicals and Petrochemicals; Directorate of Sugar; Department of Fertilizers; Directorate of Vanaspati, Vegetable Oils and Fats; Tea Board; Office of Jute Commissioner; Office of Coal Controller; Railway Board; Office of Salt Commissioner and Coffee Board. (KNN/ES)


 Loading...
