Many industry groups show negative growth in November 2013
Updated: Jan 11, 2014 12:37:00pm

New Delhi, Jan 11 (KNN) With so many industries sectors in the negative zone, the Index of Industrial output for November 2013 was disappointing.
“The General Index for the month of November 2013 stands at 162.4, which is 2.1 per cent lower as compared to the level in the month of November 2012. The cumulative growth for the period April-November 2013-14 over the corresponding period of the previous year stands at (-) 0.2 per cent,” said an official notification released yesterday.
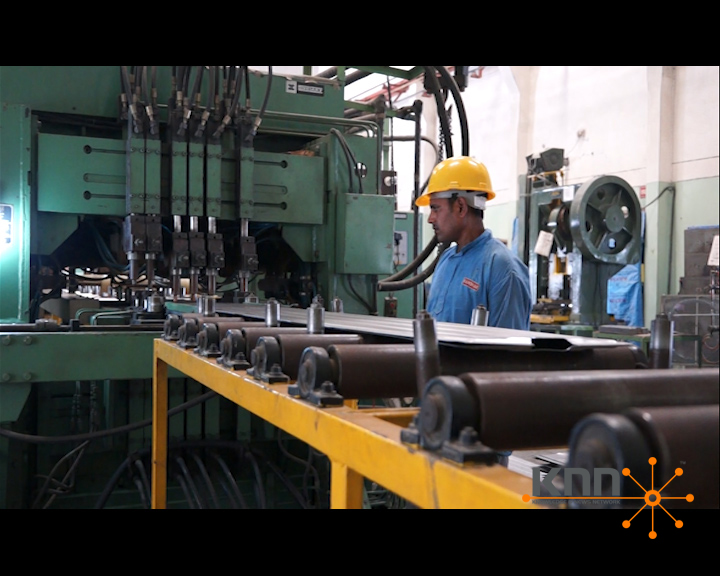
In terms of industries, 10 out of the 22 industry groups in the manufacturing sector have shown negative growth during the month of November 2013 as compared to the corresponding month of the previous year.
The industry group ‘Radio, TV and communication equipment and apparatus’ has shown the highest negative growth of (-) 42.2 per cent, followed by (-) 27.5 per cent in ‘Office, accounting and computing machinery’ and (-) 19.5 per cent in ‘Furniture; manufacturing n.e.c.’.
On the other hand, the industry group ‘Chemicals and chemical products’ has shown a positive growth of 18.6 per cent followed by 16.1 per cent in ‘Electrical machinery and apparatus n.e.c.’ and 14.5 per cent in ‘Wearing apparel; dressing and dyeing of fur’.
IIP for the mining, manufacturing and electricity sectors for November 2013 stood at 122.9, 170.3 and 158.5 respectively, with the corresponding growth rates of 1.0 per cent, (-) 3.5 per cent and 6.3 per cent as compared to November 2012. On the other hand, the cumulative growth in the three sectors during April-November 2013-14 over the corresponding period of 2012-13 has been (-) 2.2 per cent, (-) 0.6 per cent and 5.4 per cent respectively.
As per Use-based classification, the growth rates in November 2013 over November 2012 are 0.7 per cent in Basic goods, 0.3 per cent in Capital goods and 3.3 per cent in Intermediate goods. The Consumer durables and Consumer non-durables have recorded growth of (-) 21.5 per cent and 2.5 per cent respectively, with the overall growth in Consumer goods being (-) 8.7 per cent.
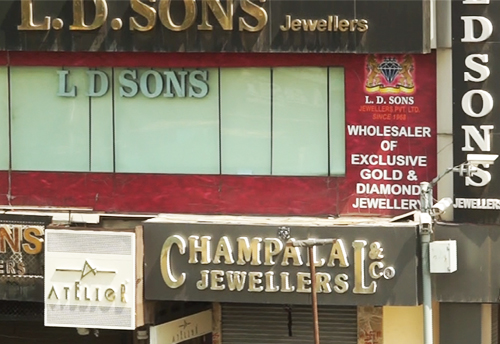
Some of the important items showing high negative growth during the current month over the same month in previous year include ‘HR Sheets’ [(-) 63.2 per cent], ‘Molasses’ [(-) 61.4 per cent], ‘Sugar (including sugar cubes)’ [(-) 56.3 per cent], ‘Boilers’ [(-) 47.0 per cent], ‘Aluminium Conductor’ [(-) 45.4 per cent], ‘Telephone Instruments (incl. Mobile Phones and Accessories)’ [(-) 44.6 per cent], ‘Earth Moving Machinery’ [(-) 44.1 per cent], ‘Gems and Jewellery’ [(-) 40.4 per cent], ‘Computers’ [(-) 35.3 per cent], ‘Sugar Machinery’ [(-) 31.6 per cent] and ‘Polyester Chips’ [(-) 28.0 per cent].
Some of the other important items showing high positive growth are: ‘Vitamins’ (302.3 per cent), ‘Ship building and repairs’ (134.8 per cent), ‘Wood Furniture’ (63.3 per cent), ‘Cable, Rubber Insulated’ (61.2 per cent), ‘Antibiotics and its preparations’ (58.1 per cent), ‘Ayurvedic Medicaments’ (52.1 per cent), ‘Air Conditioners (Room)’ (31.5 per cent), ‘Plastic Machinery (incl. Moulding Machinery)’ (28.4 per cent) and ‘Tractors’ (26.8 per cent).
IIP is compiled using data received from 16 source agencies viz. Department of Industrial Policy and Promotion (DIPP); Indian Bureau of Mines; Central Electricity Authority; Joint Plant Committee; Ministry of Petroleum and Natural Gas; Office of Textile Commissioner; Department of Chemicals and Petrochemicals; Directorate of Sugar; Department of Fertilizers; Directorate of Vanaspati, Vegetable Oils and Fats; Tea Board; Office of Jute Commissioner; Office of Coal Controller; Railway Board; Office of Salt Commissioner and Coffee Board. (KNN/ES)
“The General Index for the month of November 2013 stands at 162.4, which is 2.1 per cent lower as compared to the level in the month of November 2012. The cumulative growth for the period April-November 2013-14 over the corresponding period of the previous year stands at (-) 0.2 per cent,” said an official notification released yesterday.
In terms of industries, 10 out of the 22 industry groups in the manufacturing sector have shown negative growth during the month of November 2013 as compared to the corresponding month of the previous year.
The industry group ‘Radio, TV and communication equipment and apparatus’ has shown the highest negative growth of (-) 42.2 per cent, followed by (-) 27.5 per cent in ‘Office, accounting and computing machinery’ and (-) 19.5 per cent in ‘Furniture; manufacturing n.e.c.’.
On the other hand, the industry group ‘Chemicals and chemical products’ has shown a positive growth of 18.6 per cent followed by 16.1 per cent in ‘Electrical machinery and apparatus n.e.c.’ and 14.5 per cent in ‘Wearing apparel; dressing and dyeing of fur’.
IIP for the mining, manufacturing and electricity sectors for November 2013 stood at 122.9, 170.3 and 158.5 respectively, with the corresponding growth rates of 1.0 per cent, (-) 3.5 per cent and 6.3 per cent as compared to November 2012. On the other hand, the cumulative growth in the three sectors during April-November 2013-14 over the corresponding period of 2012-13 has been (-) 2.2 per cent, (-) 0.6 per cent and 5.4 per cent respectively.
As per Use-based classification, the growth rates in November 2013 over November 2012 are 0.7 per cent in Basic goods, 0.3 per cent in Capital goods and 3.3 per cent in Intermediate goods. The Consumer durables and Consumer non-durables have recorded growth of (-) 21.5 per cent and 2.5 per cent respectively, with the overall growth in Consumer goods being (-) 8.7 per cent.
Some of the important items showing high negative growth during the current month over the same month in previous year include ‘HR Sheets’ [(-) 63.2 per cent], ‘Molasses’ [(-) 61.4 per cent], ‘Sugar (including sugar cubes)’ [(-) 56.3 per cent], ‘Boilers’ [(-) 47.0 per cent], ‘Aluminium Conductor’ [(-) 45.4 per cent], ‘Telephone Instruments (incl. Mobile Phones and Accessories)’ [(-) 44.6 per cent], ‘Earth Moving Machinery’ [(-) 44.1 per cent], ‘Gems and Jewellery’ [(-) 40.4 per cent], ‘Computers’ [(-) 35.3 per cent], ‘Sugar Machinery’ [(-) 31.6 per cent] and ‘Polyester Chips’ [(-) 28.0 per cent].
Some of the other important items showing high positive growth are: ‘Vitamins’ (302.3 per cent), ‘Ship building and repairs’ (134.8 per cent), ‘Wood Furniture’ (63.3 per cent), ‘Cable, Rubber Insulated’ (61.2 per cent), ‘Antibiotics and its preparations’ (58.1 per cent), ‘Ayurvedic Medicaments’ (52.1 per cent), ‘Air Conditioners (Room)’ (31.5 per cent), ‘Plastic Machinery (incl. Moulding Machinery)’ (28.4 per cent) and ‘Tractors’ (26.8 per cent).
IIP is compiled using data received from 16 source agencies viz. Department of Industrial Policy and Promotion (DIPP); Indian Bureau of Mines; Central Electricity Authority; Joint Plant Committee; Ministry of Petroleum and Natural Gas; Office of Textile Commissioner; Department of Chemicals and Petrochemicals; Directorate of Sugar; Department of Fertilizers; Directorate of Vanaspati, Vegetable Oils and Fats; Tea Board; Office of Jute Commissioner; Office of Coal Controller; Railway Board; Office of Salt Commissioner and Coffee Board. (KNN/ES)


 Loading...


